2.3 Physico-Chemical Fingerprints in Coupling Matrices
The previous analysis showed that individual couplings have characterstic distributions that reflect the biophysical and steric interaction properties between amino acids. Individual coupling matrices for a residue pair that is in physcial contact often display striking patterns that agree with these findings. These patterns allow a biological interpretation of the coupling values that reveal details of the physico-chemical interdependency between both residues.
Figure 2.7 visualizes the inferred coupling matrix and single potentials \(\vi\) and \(\vj\) for a residue pair \((i,j)\) computed with the pseudo-likelihood method. The single potentials \(\via\) and \(\vja\) describe the tendency for each amino acid \(a\) to appear at positions \(i\) and \(j\), and the couplings \(\wijab\) describe the tendency of amino acid \(a\) at position \(i\) to co-occur with amino acid \(b\) at position \(j\). A cluster of strong coupling values can be observed for the couplings between the charged residues glutamic acid (E), aspartic acid (D), lysine (K) and arginine (R) and the polar residue glutamine (Q). Positive coupling values arise between positively charged residues (K, R) and negatively charged residues (E, D), whereas couplings between equally charged residues have negative values. These exemplary couplings (E-R, E-K, K-D) perfectly reflect the interaction preference for residues forming salt bridges. Indeed, in the protein structure the first residue (E) forms a salt bridge with the second residue (R) as can be seen in the left plot in Figure 2.9.
Figure 2.7: Couplings \(\wijab\) and single potentials \(\via\) and \(\vja\) computed with pseudo-likelihood for residues 6 and 82 in the carbamoyl phosphate synthetase protein (PDB id 1a9x_A domain 5). The matrix shows the 20x20 couplings \(\wijab\) with color representing coupling strength and direction (red = positive coupling value, blue = negative coupling value) and diameter of bubbles representing absolute coupling value \(|\wijab|\). Bars at the x-axis and y-axis correspond to the Potts model single potentials \(\vi\) and \(\vj\) respectively. Color reflects the value of single potentials. Amino acids are abbreviated with one-letter code and they are broadly grouped with respect to physico-chemical properties listed in Appendix B.
Figure 2.8 visualizes the coupling matrix for a pair of hydrophobic residues. Hydrophobic pairings, such as alanine (A) - isoleucine (I), or glycine (G) - isoleucine (I) have strong coupling values but the couplings also reflect a sterical constraint. Alanine is a small hydrophobic residue and it is favoured at both residue positions: it has strong positive single potentials \(\vi(A)\) and \(\vj(A)\) and strong positive couplings with isoleucine (I), leucine (L) and methionine (M). But alanine is disfavoured to appear at both positions at the same time since the A-A coupling is negative. Figure 2.9 illustrates the location of the two residues in the protein core. Here, hydrophobic residues are densely packed and the limited space allows for only small hydrophobic residues.
Figure 2.8: Couplings \(\wijab\) and single potentials \(\via\) and \(\vja\) computed with pseudo-likelihood for residues 29 and 39 in the lambda integrase protein (PDB id 1ae9_A). The matrix shows the 20x20 couplings \(\wijab\). Bars at the x-axis and y-axis correspond to the Potts model single potentials \(\vi\) and \(\vj\) respectively. Color coding is the same as in Figure 2.7
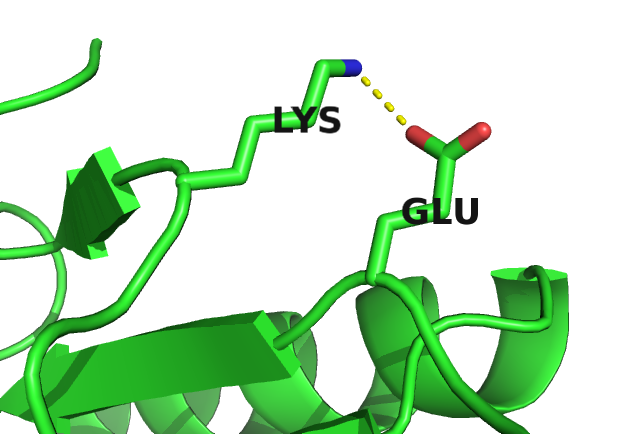
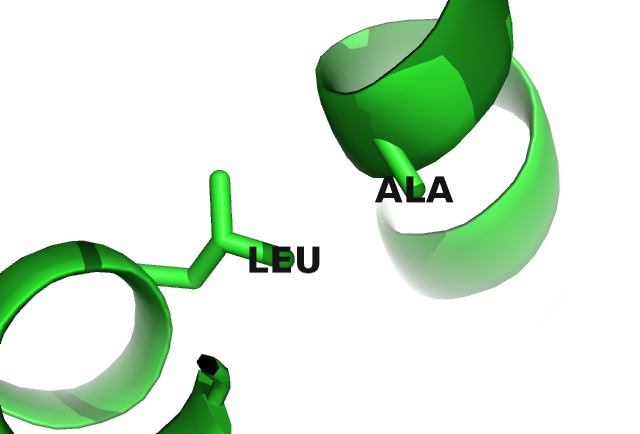
Figure 2.9: Interactions between protein side chains. Left: Glutamic acid (residue 6) forms a salt bridge with arginine (residue 82) in the carbamoyl phosphate synthetase protein (PDB id 1a9x_A domain 5). Right: Alanine (residue 29) and lysine (residue 39) within the hydrophobic core of the lambda integrase protein (PDB id 1ae9_A).
Many more biological interpretable signals can be identified from coupling matrices, including pi-cation interactions (see Figure 2.10), aromatic-proline interactions (see Figure 2.11), or disulphide bonds (see Figure 2.12).
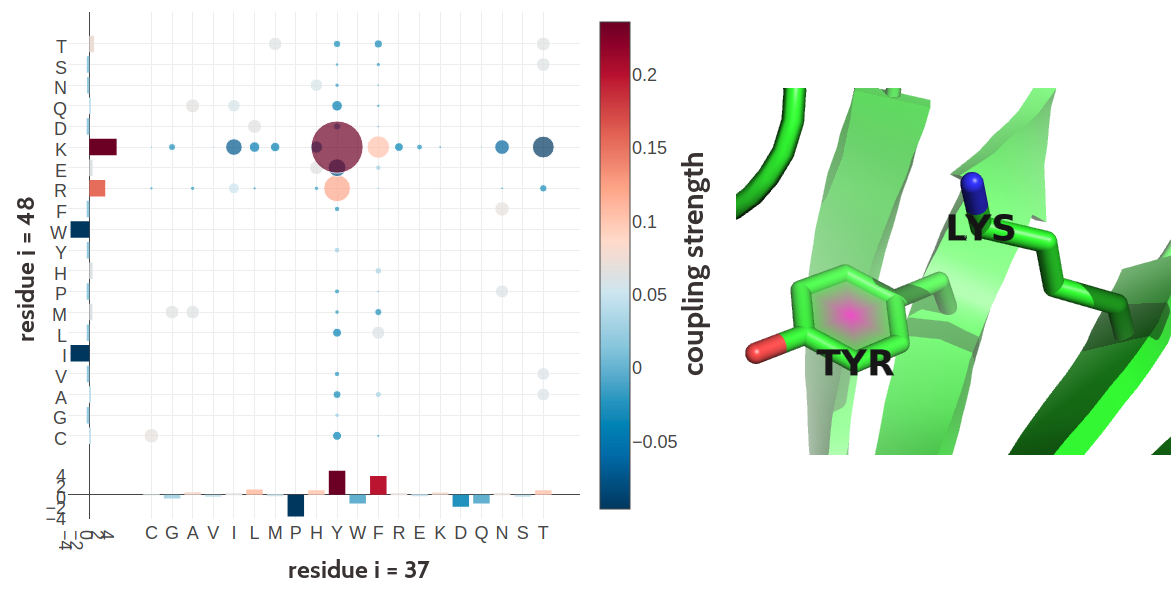
Figure 2.10: Tyrosine (residue 37) and Lysine (residue 48) forming a cation-\(\pi\) interaction in the C-terminal WRKY domain of Arabidopsis thaliana (PDB id 2ayd_A). Left Coupling matrix \(\wij\) for residue \(i\eq37\) and residue \(j\eq48\). The matrix shows the 20x20 couplings \(\wijab\). Bars at the x-axis and y-axis correspond to the Potts model single potentials \(\vi\) and \(\vj\) respectively. Color coding is the same as in Figure 2.7 Right Cation-\(\pi\) interaction between Tyrosine (residue 37) and Lysine (residue 48).
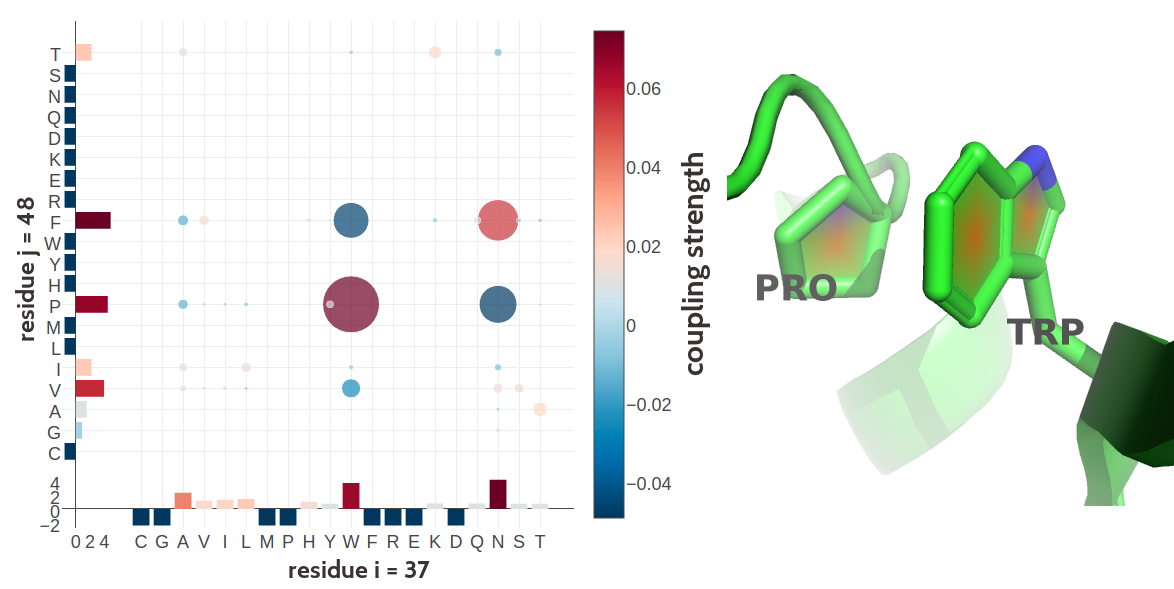
Figure 2.11: Proline and tryptophan (residues 17 and 34) forming such a CH/\(\pi\) interaction in the murine leukemia virus receptor-binding glycoprotein (PDB id 1aol_A). Left Coupling matrix \(\wij\) for residue \(i\eq17\) and residue \(j\eq34\). The matrix shows the 20x20 couplings \(\wijab\). Bars at the x-axis and y-axis correspond to the Potts model single potentials \(\vi\) and \(\vj\) respectively. Color coding is the same as in Figure 2.7 Right Proline (residues 17) and tryptophan (residues 34) stacked on top of each other engaging in a CH/\(\pi\) interaction.
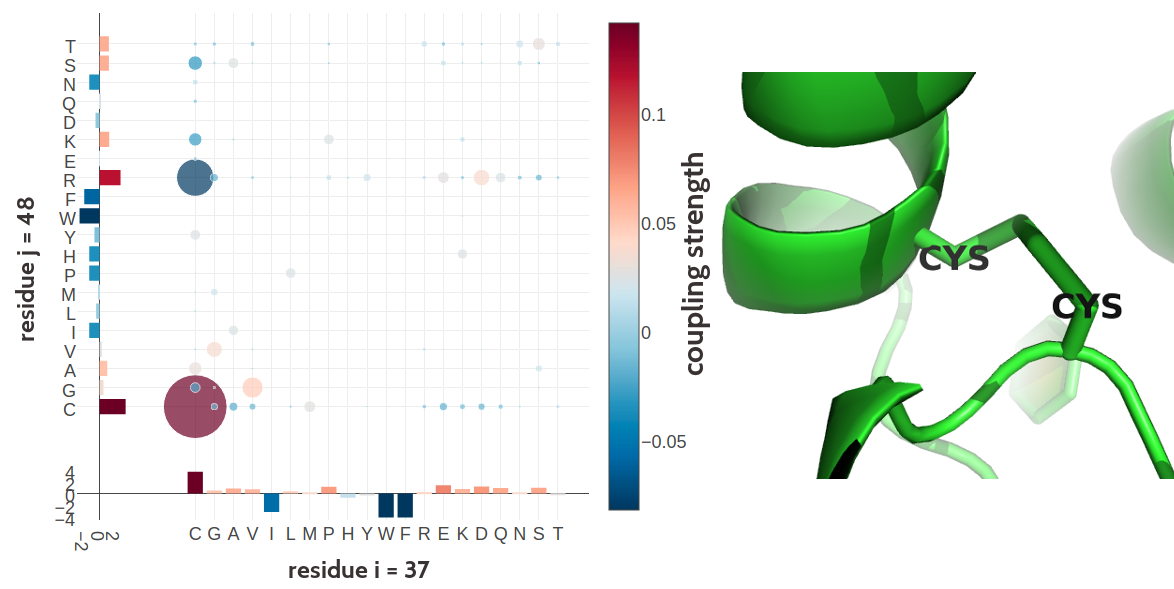
Figure 2.12: Two cystein residues (residues 54 and 64) forming a covalent disulfide bond in human interleukin-6 (PDB id 1alu_A). Left Coupling matrix \(\wij\) for residue \(i\eq54\) and residue \(j\eq64\). The matrix shows the 20x20 couplings \(\wijab\). Bars at the x-axis and y-axis correspond to the Potts model single potentials \(\vi\) and \(\vj\) respectively. Color coding is the same as in Figure 2.7 Right Difulfide bond between the cystein residues 54 and 64 in the structure.